









The latest available CSO estimate puts employment in Ireland’s accommodation and food service activities at 188.1 thousand people in 2026Q2. That is 6.8 thousand higher than 2025Q2, an increase of 3.8% calculated by CaterBoss from the published figures.
For a hospitality owner or kitchen manager, this is useful background to the size of the sector. It should not be treated as a staffing requirement for an individual business.
What the figure measures
This article uses the CSO’s QLF55 dataset, Persons aged 15–89 years in Employment. The selected series covers Ireland’s Accommodation and food service activities (NACE section I), all sexes, with values reported in thousands.
The sector combines accommodation and food service activities. It is therefore broader than a count of restaurant employees or kitchen staff. These figures are unadjusted: the comparison below does not apply seasonal adjustment.
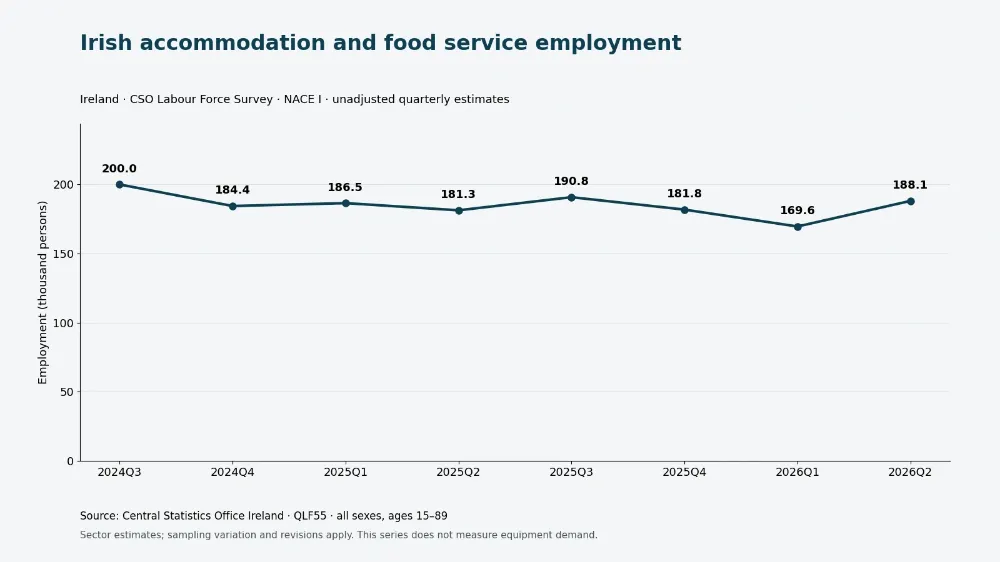
Employment over the last eight quarters
The table shows the eight most recent quarters available in the retrieved series.
| Quarter | Employment, thousands |
|---|---|
| 2024Q3 | 200.0 |
| 2024Q4 | 184.4 |
| 2025Q1 | 186.5 |
| 2025Q2 | 181.3 |
| 2025Q3 | 190.8 |
| 2025Q4 | 181.8 |
| 2026Q1 | 169.6 |
| 2026Q2 | 188.1 |
The latest estimate is higher than the same quarter a year earlier, but the intervening figures do not follow a steady upward path. Within this window, the highest observation is 200.0 thousand in 2024Q3 and the lowest is 169.6 thousand in 2026Q1. The difference is 30.4 thousand, calculated from those observations.
That spread describes the selected period. It does not establish why employment changed, prove a seasonal pattern, or predict the next quarter.
How the annual change is calculated
CaterBoss compares 2026Q2 with 2025Q2, using the same unadjusted series in both periods.
Subtracting 181.3 thousand from 188.1 thousand gives an increase of 6.8 thousand. Dividing that difference by the earlier figure and expressing it as a percentage gives 3.8%, rounded to one decimal place.
This is a calculation from CSO observations, rather than a separate CaterBoss survey or a measure of equipment demand.
What a kitchen manager can take from it
Use the figures as sector context. A national employment total does not answer how many people your own kitchen needs, whether suitable candidates are available locally, or whether a change to your layout would improve service.
As an optional local planning exercise, review your own covers, opening hours, tasks and shift coverage separately. If you are considering a workflow change, assess the actual route, space and load involved before selecting equipment.
For a separate equipment review, explore food service trolleys. Compare any option against your own requirements; the employment figures do not demonstrate a need to buy one.
Questions about the figures
Does this count only restaurant and kitchen staff?
No. The selected series covers accommodation and food service activities together, for all sexes and ages 15–89. It should not be presented as a restaurant-only or chef-only total.
Can the increase be used to forecast my staffing needs?
No. The comparison shows a change in the published national sector estimate. It does not supply a staffing formula for a particular venue or explain the cause of that change.
Methodology and limitations
Source: CSO QLF55, selecting statistic QLF055C01, sector I and all sexes. The eight-quarter table uses the most recent observations in the captured dataset. Units are thousands of people; the series is unadjusted. The annual percentage and the highest-to-lowest difference are calculations by CaterBoss.
These are Labour Force Survey estimates. The captured dataset records a planned routine revision in its update metadata. The dataset capture used here does not establish statistical significance or the cause of the movements. Broad sector figures should not be substituted for individual business records.
Referenced sources